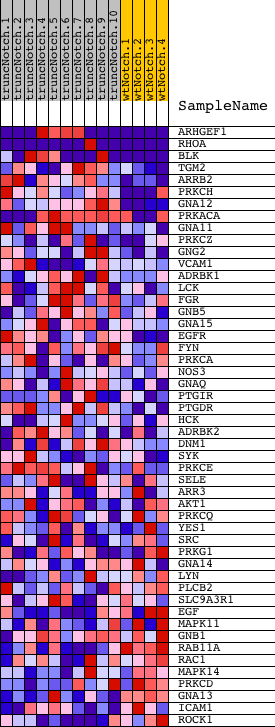
Profile of the Running ES Score & Positions of GeneSet Members on the Rank Ordered List
| Dataset | Set_03_truncNotch_versus_wtNotch.phenotype_truncNotch_versus_wtNotch.cls #truncNotch_versus_wtNotch |
| Phenotype | phenotype_truncNotch_versus_wtNotch.cls#truncNotch_versus_wtNotch |
| Upregulated in class | truncNotch |
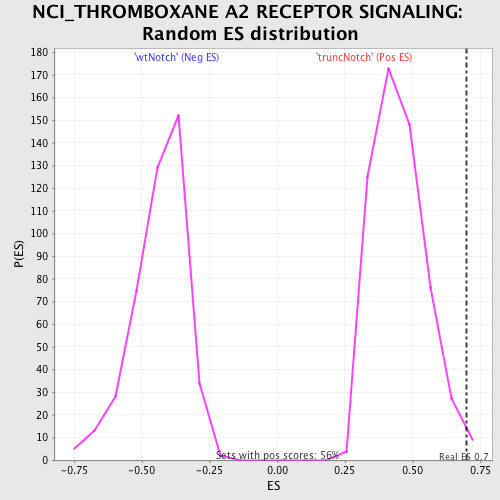
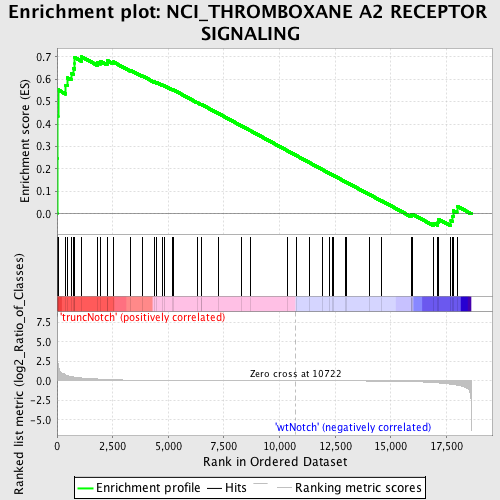
| GeneSet | NCI_THROMBOXANE A2 RECEPTOR SIGNALING |
| Enrichment Score (ES) | 0.69997275 |
| Normalized Enrichment Score (NES) | 1.5571145 |
| Nominal p-value | 0.008896797 |
| FDR q-value | 0.3697084 |
| FWER p-Value | 0.955 |
| PROBE | DESCRIPTION (from dataset) | GENE SYMBOL | GENE_TITLE | RANK IN GENE LIST | RANK METRIC SCORE | RUNNING ES | CORE ENRICHMENT | |
|---|---|---|---|---|---|---|---|---|
| 1 | ARHGEF1 | 610347 4850603 6420672 | 4 | 4.545 | 0.2476 | Yes | ||
| 2 | RHOA | 580142 5900131 5340450 | 11 | 3.476 | 0.4368 | Yes | ||
| 3 | BLK | 1940128 5390053 | 41 | 2.158 | 0.5529 | Yes | ||
| 4 | TGM2 | 5360452 | 390 | 0.740 | 0.5745 | Yes | ||
| 5 | ARRB2 | 2060441 | 469 | 0.659 | 0.6062 | Yes | ||
| 6 | PRKCH | 5720079 | 633 | 0.536 | 0.6266 | Yes | ||
| 7 | GNA12 | 1230301 | 737 | 0.495 | 0.6481 | Yes | ||
| 8 | PRKACA | 2640731 4050048 | 790 | 0.471 | 0.6710 | Yes | ||
| 9 | GNA11 | 2760156 6550671 7100068 | 794 | 0.470 | 0.6964 | Yes | ||
| 10 | PRKCZ | 3780279 | 1106 | 0.373 | 0.7000 | Yes | ||
| 11 | GNG2 | 2230390 | 1814 | 0.243 | 0.6752 | No | ||
| 12 | VCAM1 | 2900450 | 1949 | 0.222 | 0.6800 | No | ||
| 13 | ADRBK1 | 1340333 | 2249 | 0.183 | 0.6739 | No | ||
| 14 | LCK | 3360142 | 2265 | 0.181 | 0.6830 | No | ||
| 15 | FGR | 3780047 | 2521 | 0.150 | 0.6774 | No | ||
| 16 | GNB5 | 4480736 6550722 6770463 | 3289 | 0.089 | 0.6410 | No | ||
| 17 | GNA15 | 870037 | 3840 | 0.063 | 0.6148 | No | ||
| 18 | EGFR | 4920138 6480521 | 4355 | 0.047 | 0.5896 | No | ||
| 19 | FYN | 2100468 4760520 4850687 | 4488 | 0.044 | 0.5849 | No | ||
| 20 | PRKCA | 6400551 | 4720 | 0.039 | 0.5746 | No | ||
| 21 | NOS3 | 630152 670465 | 4825 | 0.037 | 0.5710 | No | ||
| 22 | GNAQ | 430670 4210131 5900736 | 5173 | 0.031 | 0.5540 | No | ||
| 23 | PTGIR | 2100563 | 5230 | 0.030 | 0.5526 | No | ||
| 24 | PTGDR | 3850161 | 6297 | 0.018 | 0.4962 | No | ||
| 25 | HCK | 4230592 | 6475 | 0.017 | 0.4876 | No | ||
| 26 | ADRBK2 | 1660692 | 6493 | 0.016 | 0.4876 | No | ||
| 27 | DNM1 | 1660097 5340519 | 7255 | 0.012 | 0.4472 | No | ||
| 28 | SYK | 6940133 | 8308 | 0.007 | 0.3910 | No | ||
| 29 | PRKCE | 5700053 | 8671 | 0.006 | 0.3718 | No | ||
| 30 | SELE | 7100368 | 10358 | 0.001 | 0.2811 | No | ||
| 31 | ARR3 | 130142 3850132 | 10748 | -0.000 | 0.2601 | No | ||
| 32 | AKT1 | 5290746 | 11364 | -0.002 | 0.2271 | No | ||
| 33 | PRKCQ | 2260170 3870193 | 11911 | -0.004 | 0.1979 | No | ||
| 34 | YES1 | 6100050 | 12234 | -0.005 | 0.1808 | No | ||
| 35 | SRC | 580132 | 12358 | -0.005 | 0.1745 | No | ||
| 36 | PRKG1 | 4120671 | 12420 | -0.006 | 0.1715 | No | ||
| 37 | GNA14 | 3390017 | 12941 | -0.008 | 0.1439 | No | ||
| 38 | LYN | 6040600 | 12993 | -0.008 | 0.1416 | No | ||
| 39 | PLCB2 | 360132 | 14047 | -0.017 | 0.0858 | No | ||
| 40 | SLC9A3R1 | 6020373 | 14591 | -0.026 | 0.0580 | No | ||
| 41 | EGF | 5220154 | 15914 | -0.089 | -0.0084 | No | ||
| 42 | MAPK11 | 130452 3120440 3610465 | 15915 | -0.089 | -0.0035 | No | ||
| 43 | GNB1 | 2120397 | 15968 | -0.093 | -0.0012 | No | ||
| 44 | RAB11A | 5360079 | 16932 | -0.220 | -0.0411 | No | ||
| 45 | RAC1 | 4810687 | 17117 | -0.256 | -0.0370 | No | ||
| 46 | MAPK14 | 5290731 | 17146 | -0.262 | -0.0243 | No | ||
| 47 | PRKCD | 770592 | 17700 | -0.425 | -0.0309 | No | ||
| 48 | GNA13 | 4590102 | 17781 | -0.455 | -0.0104 | No | ||
| 49 | ICAM1 | 6980138 | 17815 | -0.472 | 0.0136 | No | ||
| 50 | ROCK1 | 130044 | 17976 | -0.542 | 0.0345 | No |